
Every leader rolling out AI wants to know what it’s worth. This post is how I’d answer that honestly, out of your own delivery data, and it’s the same measurement I set up for organizations at Lil Agile Monster.

Right now, every executive is asking "How much more can we get done by implementing AI?"
I recently spent six months inside an Insurtech organization where we rebuilt the way they work. I was asking the same thing those executives are asking, with a self-serving edge on it. I wanted to know how much of that number was Kanban and how much was AI, because the Kanban was mine and I wanted to show it had been worth it. By the end of the engagement, the teams were finishing four to five times as many work items a month as they had in the last normal year. The items were about the same size as before, and the teams were smaller. Most people would credit AI with the success, but I'm not going to hand this to AI. Not because I doubt AI did some of it. I'm pretty sure it did a lot of it. But "pretty sure" is the honest way to say it. The minute I upgrade that to "AI did this," I'm pointing at a cause I can't actually demonstrate and downplaying the impact that the Kanban strategy had.
So here's why the number is real, why the attribution isn't, and what you can actually find out about your own rollout.
The number holds up
We experienced four to five times more finished work items per month after the new model was running in comparison to a typical month in the last normal operations year. We counted work items, not story points, not effort, not anyone's self-report about how productive they felt. (And I know what everyone is thinking...that's just output, not outcomes. I totally agree, but for today, we are going to use the easy number.)
You'll notice I just compared two periods, and later I'm going to show you why that kind of comparison usually can't tell you whether anything really changed. Fair. This comparison works for two reasons. First, the gap is far too large to be ordinary variation. Second, I specifically went after the following three objections that could invalidate the comparison.
"Your baseline was artificially low." The obvious before-period was distorted, because most effort had been redirected into a platform rebuild tracked somewhere else entirely, so ordinary delivery only looked thin. I threw that period out and went back to the last year of normal operations.
"You counted smaller items." Checked, and the answer is no. Not by a metric, because item size isn't something the data holds, for anyone. It's answered by the people who know this work, and they're certain that today's items are consistent in scope with the older ones. The categorization of work changed to items being typed as epics or new features. We also started to deliberately slice work by value. If anything, moving from tasks toward units of delivered value cuts against the objection rather than for it.
"You hired more people." The opposite happened. The team got smaller over the period, so output rose while the organization shrank.
The attribution doesn't hold up at all
Here's what else happened in the same quarter the AI tooling arrived.
Kanban training. WIP limits. Team boards where none had existed. A pull system replacing an assignment system. Workflow policies that humans and AI had to follow. Flow metrics that made aging work visible for the first time. A pod structure that changed who worked with whom, and a complete restructure of our portfolio.
The AI tooling and the operating-model change were one overlapping transformation, not two sequenced phases. There's no window where AI changed and nothing else did.
I could construct an argument. I could point at which metric each lever should move, look at which ones actually moved, and reason backwards, and I did exactly that. It's directional at best, which means it gets you a sign and never a size. It says AI probably drove the volume and the operating-model change probably drove the predictability, which is worth knowing but isn't a number. And it leans on each lever having its own signature metric, which isn't quite true, because WIP limits can raise throughput and AI can shorten cycle time.
Your rollout has this problem too
This isn't my special misfortune, it's the normal case when you are rolling out AI or Kanban. Nobody deploys AI or starts a transformation in a frozen organization. It arrives with an executive mandate, which changes what people prioritize, and it arrives next to new tooling, a reorganization, a hiring freeze, or a burst of leadership attention on delivery that would have moved the numbers by itself. Every AI productivity claim you read this year has at least one uncontrolled variable sitting beside it. Mine are written down because I went looking for them. In most cases nobody looks, which doesn't mean the variables are absent, only that nobody names them.
What you can actually know
There are two questions here and almost everyone collapses them into one. Did anything change? That's answerable. Did AI change it? Probably, but by how much is hard to nail down.
The first one has an instrument, a process behavior chart (PBC). It's old and cheap and almost nobody in this argument is using it. A real one is two graphs stacked, an individuals chart on top and a moving range chart underneath, and you'll sometimes see it called an XmR chart.
Four steps to build it:
- Plot your weekly throughput on the top chart, going back as far as you have clean data. Weekly absorbs day-of-week patterns and still builds up data points reasonably fast. Monthly works if that's what you have, it just takes longer to say anything.
- Plot the gaps underneath. Each week minus the week before it. That bottom chart is the moving range chart, and it's the half that gets left off.
- Add an average line to each chart.
- Calculate the natural process limits for the top chart. They come out of the average of those gaps, not from a target and not from what you'd like to be true.
Read the bottom chart first. The limits above it are built from those gaps, so if the gaps are jumping around then the limits mean nothing and the top chart is just authoritative-looking noise. When the gaps are steady, which is what you want to see, the limits are worth trusting and you can go read the top chart.
Everything inside those limits is your system being itself. It isn't a result, it isn't caused by anything in particular, and it doesn't need explaining. Explaining it anyway is how organizations spend entire quarters chasing ghosts.
A real change announces itself in specific ways. On the top chart the two clearest are a week that falls outside the natural process limits, or a run of eight consecutive weeks on one side of the average throughput line. There are a couple more, and they're all just formal ways of saying "that pattern is too consistent to be chance." The bottom chart gets one rule and only one, a gap bigger than the upper range limit, meaning that jump was larger than your system produces on its own, so go find out what happened between those two weeks. Run rules don't apply down there, because each gap shares a week with the one next to it.
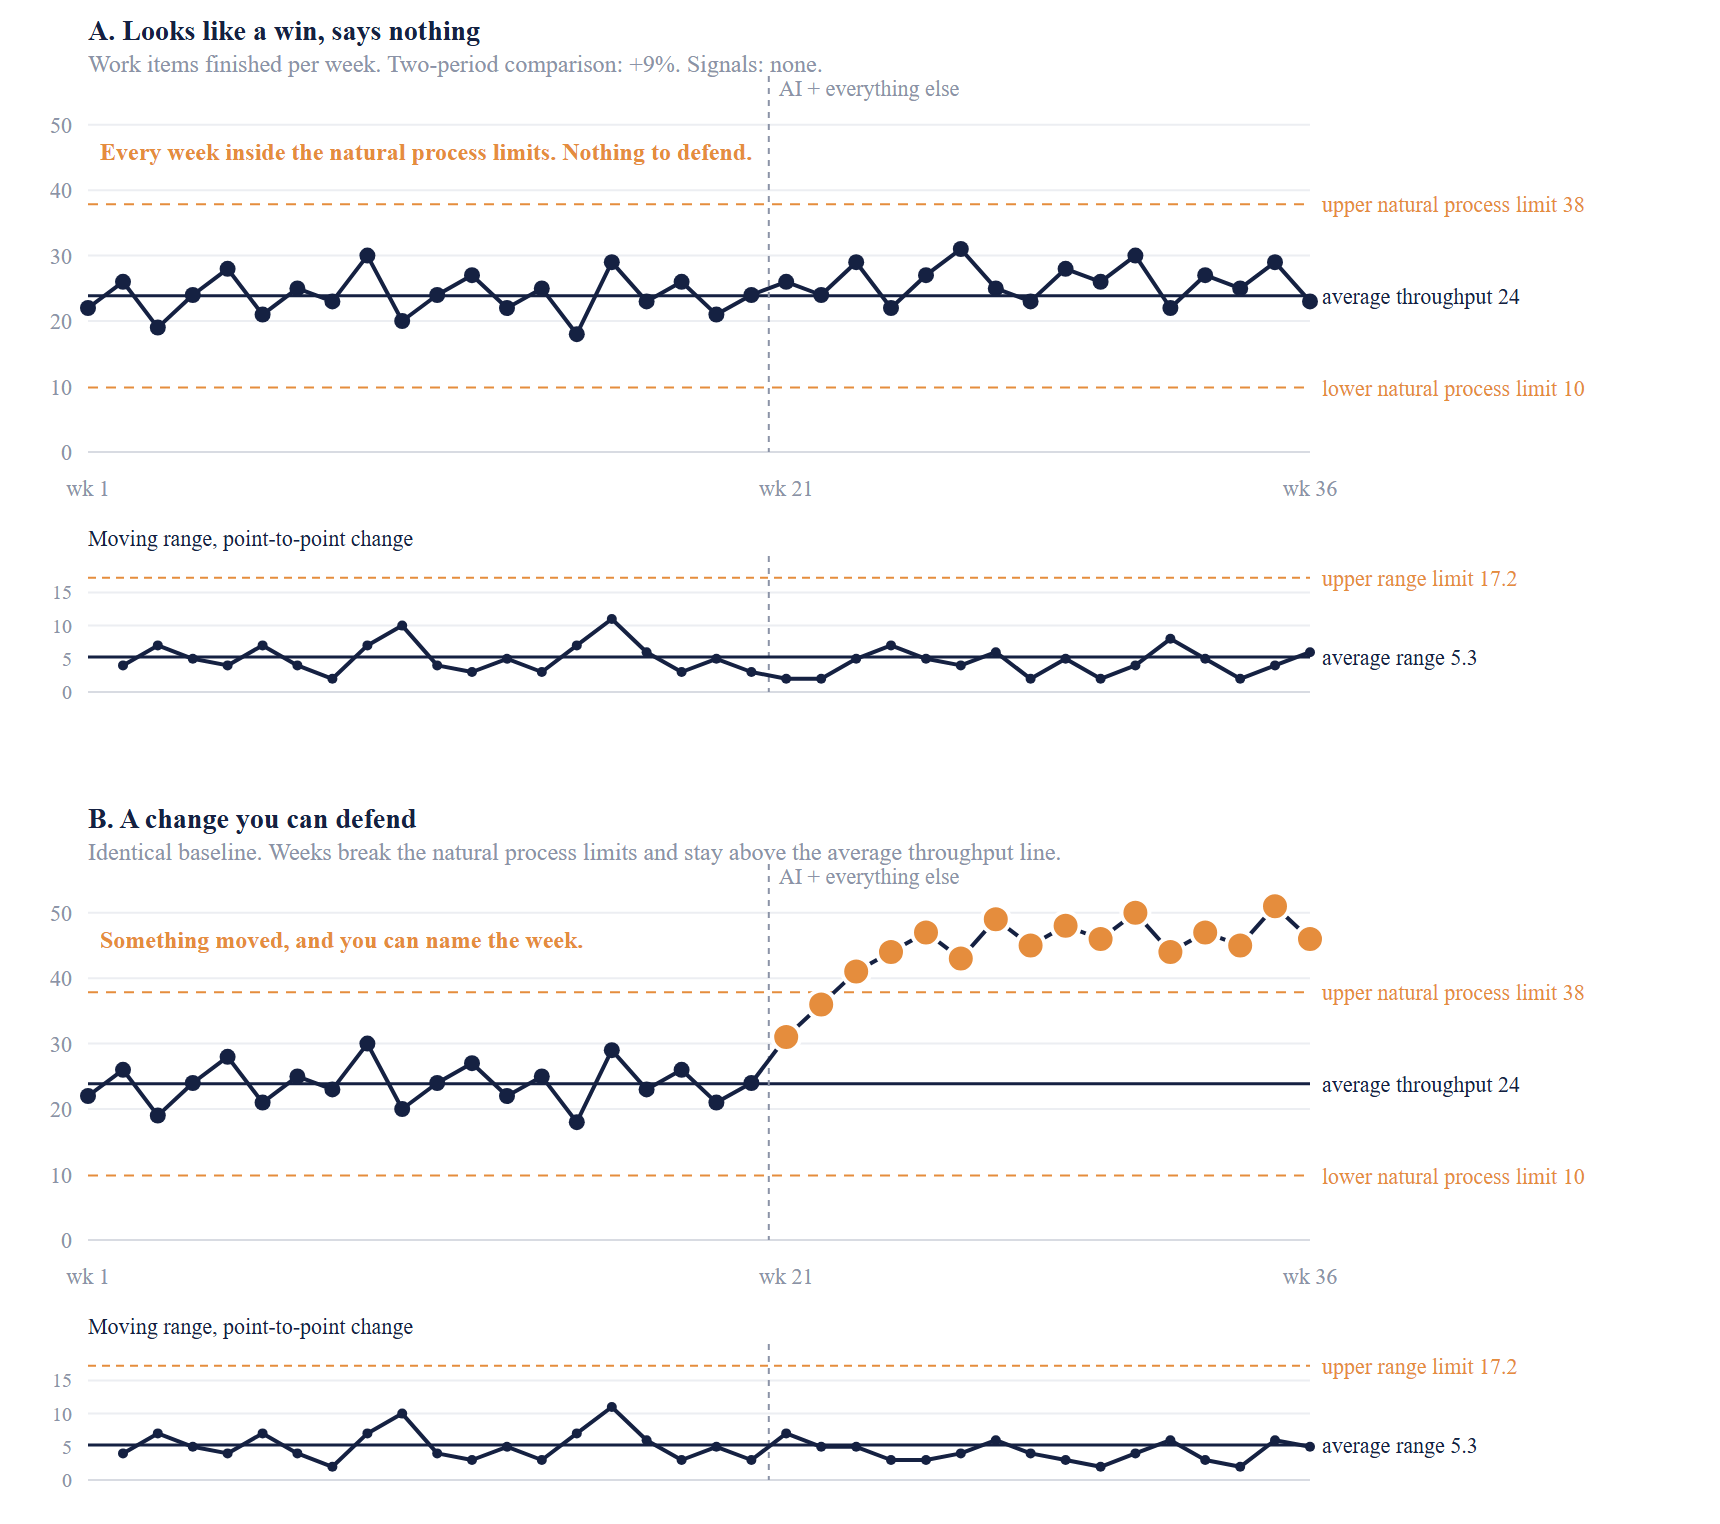
Illustrative data, built to show both cases against one shared baseline. Both rollouts look like wins if you compare two periods, panel A by 9% and panel B by 87%. Only panel B produces a signal, and it takes three weeks after the rollout before the first week falls outside the natural process limits. The two weeks before that are caught by the weaker tests, which is what they are for. The moving ranges stay inside the upper range limit in both, so the variation is steady and the limits above it hold. Panel B is also worth a second look, because a change that arrives gradually rather than all at once shows up loudly on the top chart and not at all on the bottom one.
The 6x that wasn't
Here's how easily this goes wrong, from the same organization.
At one point the monthly count jumped roughly six-fold between one December and the following January, right as the AI transformation was getting underway. The PBC did exactly what it should have done. The point sat well outside the natural process limits, and a point that far out means something genuinely changed. If I'd been looking for a win for my Kanban implementation, that's a number I could have quoted to make myself look good.
Something had changed. It just wasn't delivery. It was an artifact of cleaning up and restructuring the existing system, with work flowing back into the projects I was counting and items long finished finally being closed...so nothing got faster and nothing improved, the work just moved homes. The chart was right and my conclusion would have been wrong. A signal tells you the system is no longer the system you measured. It doesn't tell you which part of it moved. I caught it because I went looking for reasons the number might be lying, which is what I do with any number I like the look of. But fair warning, that's also the first habit to go when someone needs to prove a rollout worked.
Where this chart lets you down
I've just handed you an instrument, so let me tell you where it fails. Six places, and the first two are why most people who try this get an answer they shouldn't trust.
You probably don't have enough weeks before the change. The natural process limits get built from the baseline alone, so it's the weeks before your rollout that carry the weight, not the total you have. Ten to twenty data points is the working range, because under about a dozen the limits move around too much to mean anything, and past twenty you're building them from a system that may not exist anymore. If you are asking whether AI helped and only have about six weeks on either side, that fails twice over. Six baseline weeks won't give you natural process limits worth trusting, and six weeks afterwards can't produce a run of eight consecutive points on one side of the average throughput line, so one of your detection rules is unavailable before you start.
Building the limits with the rollout included. This is the trap that catches careful people. If you calculate the natural process limits across the entire series, the post-rollout weeks feed into the gaps those limits are built from, and a genuine improvement widens the band until it fits comfortably inside...so the change hides itself in its own evidence. Compute them on the baseline period alone, then extend them forward and watch whether the new weeks fall outside.
A quiet top chart can still be hiding a real improvement. No signal means any change is smaller than your own week-to-week variation. A real fifteen percent improvement can sit inside the natural process limits indefinitely without ever declaring itself. So, the chart sets a floor on what you can claim, not a verdict on what's true.
A count can't see the size of what you counted. This is the one that should worry you most about AI specifically, because AI makes splitting work easy. Split the same quarter's work into twice as many items and your throughput doubles while exactly the same value ships, which is a clean, convincing signal produced by nothing at all. That's why the size question mattered more than the counts in my own check, and why counts belong inside the team while leadership gets outcomes. Splitting an item in two doubles your throughput and does nothing to the outcome.
Your counting rules have to be consistent. The chart assumes each week is comparable to the one before it. Change the definition of finished, merge two projects, restructure a workflow, or adjust the query, and the series quietly stops comparing like with like. What you'll see is a signal that's really an administrative event. That's exactly the 6x change I saw above. The chart flagged it correctly, and I'd still have read it wrong if I hadn't gone and checked what changed in the counting.
Batching manufactures signals. If work closes in a lump at month-end or on a release cadence, you get a sawtooth, with quiet weeks and then a spike big enough to breach the natural process limits when nothing has changed. The chart wants each week to be an independent look at the same process, and batched delivery just isn't that.
None of this makes the PBC useless. It makes it a floor rather than a verdict, which is the right thing to want from a measurement. It gets you from "somebody says it's faster" to "something moved and here's the week it moved," and that's a real upgrade even though it's still short of knowing why.
Do this with your own numbers
Pull every work item your teams finished over the last six to twelve months, with the date it finished. That's the only data you need. Count them per complete week, build the chart, and mark the date your rollout started.
If there's no signal, you don't have a result. You have a hypothesis, and that's a fine thing to have as long as you call it one.
If there is a signal, good. Now write down everything else that changed in that window, honestly. If that list isn't empty then you have a change you can't attribute, and saying so out loud is a stronger position than claiming it. It's the position I'm in, and I'd rather be here with the evidence than somewhere more comfortable without it.
And if you can't get a clean finish date for your work items, stop. That's your real finding, and it's bigger than anything AI did or didn't do.
The question this leaves
If a flat chart is what you get, and it's what many organizations will get, then the interesting question was never whether AI is working. It's "what's actually governing how fast work is leaving our system?" given that it obviously isn't how fast the code gets written.
That's the next post, and it's up now: AI boosted your throughput. Your strategy didn't move. It's about where the time goes once building stops being the slow part, and why your strategic work is the last thing to feel the difference..
And if you do run this on your own numbers and get something surprising, let me know. I'd genuinely like to hear about it.
Photo by Rolands Varsbergs on Unsplash